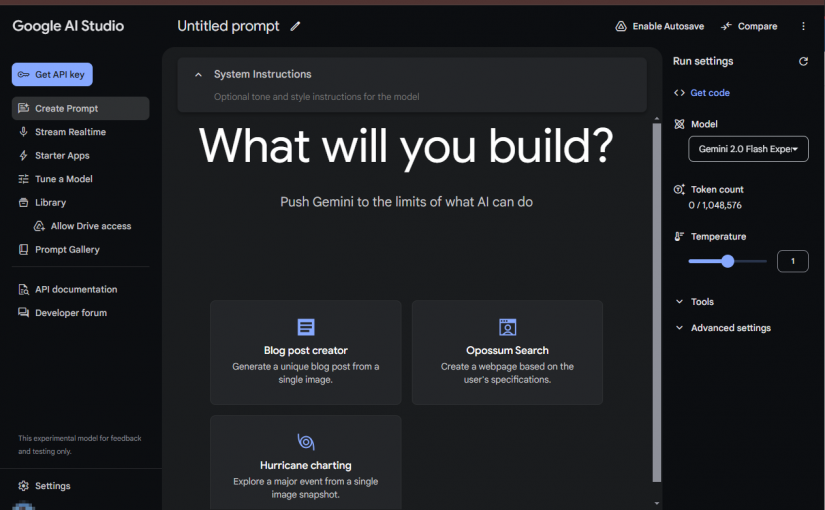
Google AI Studio (https://aistudio.google.com/) offers a powerful platform for developers and researchers to experiment with and build applications using Google’s advanced AI models, notably Gemini. This experimental model provides a user-friendly interface for accessing and utilizing the capabilities of Gemini, allowing users to create a variety of applications without extensive coding experience. While still in its experimental phase, the platform is continuously evolving and expanding its capabilities. Let’s delve into its core functionality and highlight three key features:
Core Functionality:
Google AI Studio’s core functionality revolves around providing a streamlined environment for users to interact with Gemini. The platform simplifies the process of constructing applications using this powerful language model. Instead of requiring users to navigate complex API documentation and write extensive code, the studio offers a visual interface and pre-built functionalities to facilitate rapid prototyping and development. This makes it accessible to a wider audience, including those without extensive programming expertise. The focus is on making the power of AI readily available for creative projects and practical applications.
Three Notable Features:
- Stream Realtime: This feature stands out for its ability to generate dynamic and responsive applications. Instead of simply providing a static output, Stream Realtime allows for ongoing interaction with the Gemini model. Imagine building a real-time chatbot, a live content generator, or a dynamic data analysis tool—all powered by the responsiveness of Stream Realtime. This feature opens doors to applications requiring continuous feedback and dynamic updates.
- Blog Post Creator: This feature showcases the creative potential of Gemini within AI Studio. By inputting a single image, the model can generate a unique blog post. This is not merely a caption generator; it can weave a narrative, draw insights from the visual content, and craft a compelling piece of writing. This demonstrates Gemini’s ability to understand and interpret visual information, transforming it into coherent and engaging textual content. This is a powerful tool for content creators seeking rapid inspiration or assistance. In fact, this entire article, except for this sentence, was built using only the included image.
- Hurricane Charting: This exemplifies the application of Gemini to data visualization and analysis. By uploading a single image snapshot (likely a satellite image or weather map), the model can help users explore and chart the details of a major hurricane event. This points towards the potential use of Gemini in processing and interpreting complex datasets, providing valuable insights and visualizations for various fields, such as meteorology, disaster management, and environmental science.
Conclusion:
Google AI Studio, with its Gemini integration, offers a compelling platform for exploring and building AI-powered applications. The intuitive interface and readily available functionalities make this platform accessible to a broad range of users. While in its experimental phase, its potential is evident, particularly with features like Stream Realtime enabling the development of dynamic and interactive applications. As Google continues to refine and expand AI Studio, it will undoubtedly become an increasingly powerful tool in the ever-evolving landscape of artificial intelligence.

